
Yes, gym digital signage produces a positive return when it drives incremental memberships, class fills, and retail sales, and when you measure it properly. A University of Bath field experiment found a notable average purchase-lift from in-store digital signage, and that same mechanism applies to class signups and front-desk promotions. Run a short pilot, track the right numbers, and use the worksheet below to see if it pencils out for your gym.
TL;DR:
- Count incremental memberships, class bookings, retail sales, retention, and staff time saved; apply each category’s gross margin before comparing gains with monthly costs.
- Separate hardware and installation from recurring software, content, and licensing costs; spread display costs over five to seven years and add a 10% installation contingency.
- Test two to four high traffic screens for four to eight weeks using unique codes or QR scans, and compare results with an unchanged baseline.
- Retail research found an 8.1% average purchase lift across 237 campaigns and 30 million shoppers; treat it as context, not a gym forecast.
- A one to four month pilot payback is reasonable; results taking more than six months usually point to poor placement or content.
Table of Contents
- How to calculate gym digital signage ROI
- Costs to include: CAPEX and OPEX for gym digital signage
- Where the revenue and savings actually come from
- Metrics and KPIs to track
- Sample ROI model and worked walkthrough
- Benchmarks and evidence worth trusting
- How to run a pilot and measure impact
- What actually moves the needle in gyms
- Run your pilot on one dashboard instead of five tools
- FAQ
- Sources
How to calculate gym digital signage ROI
ROI for a gym screen program comes down to one formula: subtract total costs from incremental gains, then divide by total costs. The hard part is not the math, it is identifying every gain stream and every cost honestly instead of only counting the obvious ones.
Start with the gains side. A gym typically sees value from several sources at once, and leaving any out understates the real return:
- Incremental memberships from trial conversions or limited-time offers displayed on screens.
- Incremental class enrollments from last-minute fill promotions shown near the studio or front desk.
- Retail and point-of-sale uplift when screens promote supplements, apparel, or add-on services near checkout.
- Retention value when existing members respond to renewal reminders or loyalty messaging.
- Labor savings when screens replace manual announcements, printed schedules, or staff time spent redirecting members to class changes.
To run the numbers, you need five inputs: baseline monthly revenue for each gain category, the percentage uplift you expect or measure, your gross margin on that revenue, total monthly operating cost of the signage program, and the one-time setup cost spread over its useful life.
Here is a simplified example. Add $300 from two extra class fills per week at a $25 drop-in rate, and $150 in saved staff time from automated schedule displays. Total incremental monthly value: $690. If monthly signage costs (software, content, amortized hardware) run $220, net monthly gain is $470.
That example uses conservative, illustrative numbers, not benchmarks. Your actual uplift depends on screen placement, content quality, and how closely your promotions tie to a specific action, like scanning a code or mentioning an offer at checkout. The next sections break down the real cost and benefit categories so you can plug in your own figures.

Costs to include: CAPEX and OPEX for gym digital signage
An honest ROI model separates one-time capital costs from ongoing operating costs, then annualizes both so they are comparable to monthly revenue gains.
- CAPEX: screens or TVs, wall mounts or ceiling brackets, media players or streaming devices, and any cabling or electrical work needed at install.
- OPEX: software subscription fees, content creation or template costs, music licensing for synced audio, and routine maintenance or screen replacement reserves.
- Annualizing CAPEX: divide total hardware cost by its expected useful life (typically 5 to 7 years for commercial displays) to get a monthly equivalent you can add to OPEX.
- Multi-year licenses: spread any annual or multi-year software commitment evenly across its term rather than booking it as a single month's cost.
- Hidden costs: installation labor, network upgrades if your facility's Wi-Fi can't handle streaming to multiple screens, and staff training time to manage content updates.
Hidden costs are the ones that quietly wreck a payback estimate. Installation labor alone can run several hundred dollars per screen if you're hiring an electrician or AV installer rather than mounting units yourself, and a facility with outdated networking gear may need a router or switch upgrade before screens can stream reliably. Our guide to cost-effective signage features walks through which hardware and platform features matter most when your budget is tight, so you avoid overspending on capabilities you won't use.
Pro Tip: Build a 10% contingency line into your CAPEX estimate for cabling, mounts, or network fixes you won't know you need until install day.
Where the revenue and savings actually come from
Gym signage creates value in a handful of specific, repeatable ways rather than through vague "engagement." Knowing which lever applies to your facility helps you set realistic uplift targets before you run a pilot.
- Membership conversion: time-limited trial offers or referral promotions displayed at the front desk nudge undecided prospects toward signing up.
- Class fill rate: screens near the studio entrance or in common areas can advertise open spots in the next class, capturing walk-ins who weren't planning to attend.
- Retail uplift: promoting supplements, apparel, or recovery products on screens near the point of sale mirrors the retail purchase-lift effect documented in broader retail research, where proximity to the product matters as much as the message itself.
- Operational savings: replacing printed class schedules and handwritten whiteboards with digital displays cuts reprinting costs and reduces the time front-desk staff spend answering schedule questions.
- Retention support: renewal reminders, member milestone shoutouts, and loyalty program updates shown on screens keep retention messaging visible without extra staff effort.
Our breakdown of how gym screens support class enrollment drives covers specific placement and timing tactics for the enrollment lever, and our manager's guide to TV screens and gym revenue maps out how screen placement connects to each revenue stream above.
Metrics and KPIs to track
A handful of metrics tell you almost everything you need to know about whether signage is working, and chasing more than that usually just adds noise.
- Impressions or exposures: how many members or visitors pass a given screen during a campaign window.
- Call-to-action conversions: unique promo codes or QR scans tied to a specific screen and offer.
- Class fill rate: enrollment numbers in the hours immediately following a fill promotion, compared to a baseline period.
- POS sales during exposure windows: retail transactions timestamped against when a promoted product was on screen.
- Retention signals: renewal rate or check-in frequency among members exposed to retention messaging versus those who weren't.
The University of Bath field experiment analyzed 237 campaigns and roughly 30 million shoppers, finding an 8.1% average purchase-lift from in-store digital signage, with effects varying by product type, time of day, and how close the screen sat to the promoted item.
To make attribution practical, assign a unique promo code or QR code per screen and per campaign, pair POS timestamps with content logs, and segment results by time of day since morning and evening crowds respond differently. Give any test at least a few weeks of data before drawing conclusions, and account for moderators like weekend crowding or unusually quiet weeks before you credit or blame the signage.
Sample ROI model and worked walkthrough
A reusable worksheet beats a one-off calculation because you can rerun it every time you add a screen or change a promotion. Start with these inputs and adjust the defaults to match your facility.
- Number of screens and their monthly cost (subscription plus amortized hardware).
- Baseline monthly revenue for memberships, classes, and retail.
- Expected percentage uplift for each category, based on your pilot data or conservative industry ranges.
- Gross margin on each revenue category, since retail margin differs sharply from membership margin.
- One-time setup cost, divided by useful life in months to get a monthly CAPEX equivalent.
Here's a conservative-versus-optimistic comparison using illustrative numbers for a mid-size gym with four screens:
- Conservative scenario: $5,000 monthly retail baseline with a 3% uplift ($150), one extra class fill per week at $20 ($80 monthly), and $100 in labor savings. Total incremental revenue: $330. Monthly cost: $280. Net gain: $50, for a monthly ROI near 18% and a payback period of several months.
- Optimistic scenario: the same $5,000 retail baseline with a 7% uplift ($350), three extra class fills per week ($240), and $150 in labor savings. Total incremental revenue: $740. Monthly cost stays at $280. Net gain: $460, a monthly ROI above 160%, with payback in under a month.
The gap between those two scenarios comes almost entirely from the uplift percentage and content cost assumptions, which is why a pilot matters more than a spreadsheet guess. A boutique studio with high class density and tight floor space tends to land closer to the optimistic case because screens sit near both the point of sale and the class schedule. A big-box gym with sprawling square footage often needs more screens and stronger content to hit the same uplift, which pushes payback out. Our digital posters playbook for multi-location gyms covers how to scale a working model across additional sites once your pilot numbers hold up. For most gym formats, a payback period of one to four months on a pilot is a reasonable target before committing to a full rollout; anything stretching past six months usually signals a placement or content problem rather than a signage problem.
Benchmarks and evidence worth trusting
The strongest evidence for signage-driven purchase lift comes from a large field experiment rather than marketing claims. Trade reporting adds useful context on market scale and typical format comparisons, but it should supplement, not replace, format-specific benchmarks.
- University of Bath field experiment: 237 campaigns and approximately 30 million shoppers showed an 8.1% average purchase-lift, with larger effects for novel or lower-priced products and signage placed close to the item.
- Commercial Integrator's digital signage guide: trade reporting citing AVIXA market data shows strong growth in commercial signage adoption, with some retail case studies reporting uplifts as high as 33% when motion displays replaced static print signage.
- Zatrovo's fitness studio benchmarking guidance: format-specific comparison matters, since a boutique studio's KPI baseline looks nothing like a big-box gym's, and applying one format's benchmark to the other produces misleading conclusions.
The safest approach is to pull your gym's own baseline numbers, run a pilot, and compare results to a benchmark cohort in your own format rather than a blended industry average.
How to run a pilot and measure impact
A short, well-instrumented pilot tells you more than months of guessing. Keep it simple enough to finish in under two months.
- Pick two to four screens in high-traffic zones, ideally near the front desk or class entrance.
- Run the test for four to eight weeks, comparing against either a prior period or a matched location without the new content.
- Assign a unique promo code or QR code to each screen and campaign.
- Pair POS timestamps and class-roster data with your content schedule to see when promotions ran.
- At the end of the test, calculate incremental revenue, check whether the lift holds across different days and times, and flag any moderators like holiday weeks or weather that skewed results.
Running synchronized content and audio across multiple rooms from one dashboard removes a lot of the setup friction that normally slows a pilot down. Instead of manually updating separate screens in the lobby, studio, and free-weight area, a unified system lets you push a single promotion everywhere at once and pull consistent data back. Our setup checklist for gym digital signage walks through the configuration steps in more detail.
Pro Tip: Keep your pilot's control screens completely unchanged during the test window, even if you're tempted to tweak them, so your comparison stays clean.
What actually moves the needle in gyms
Signage tends to deliver the strongest returns where foot traffic, point-of-sale, and class schedules intersect, like a front desk that doubles as a retail counter. The biggest mistake we see is borrowing a generic industry benchmark instead of running a short pilot against your own baseline. Pull your numbers, test for four to eight weeks, and let the worksheet tell you whether a full rollout makes sense before you commit budget to it.
— Kingdom
Run your pilot on one dashboard instead of five tools
Managing screens, class schedules, and room-by-room audio through separate systems eats the labor savings signage is supposed to create. A unified platform that puts TVs, class content, and synced music across every room on one dashboard can reduce setup time for pilots significantly.
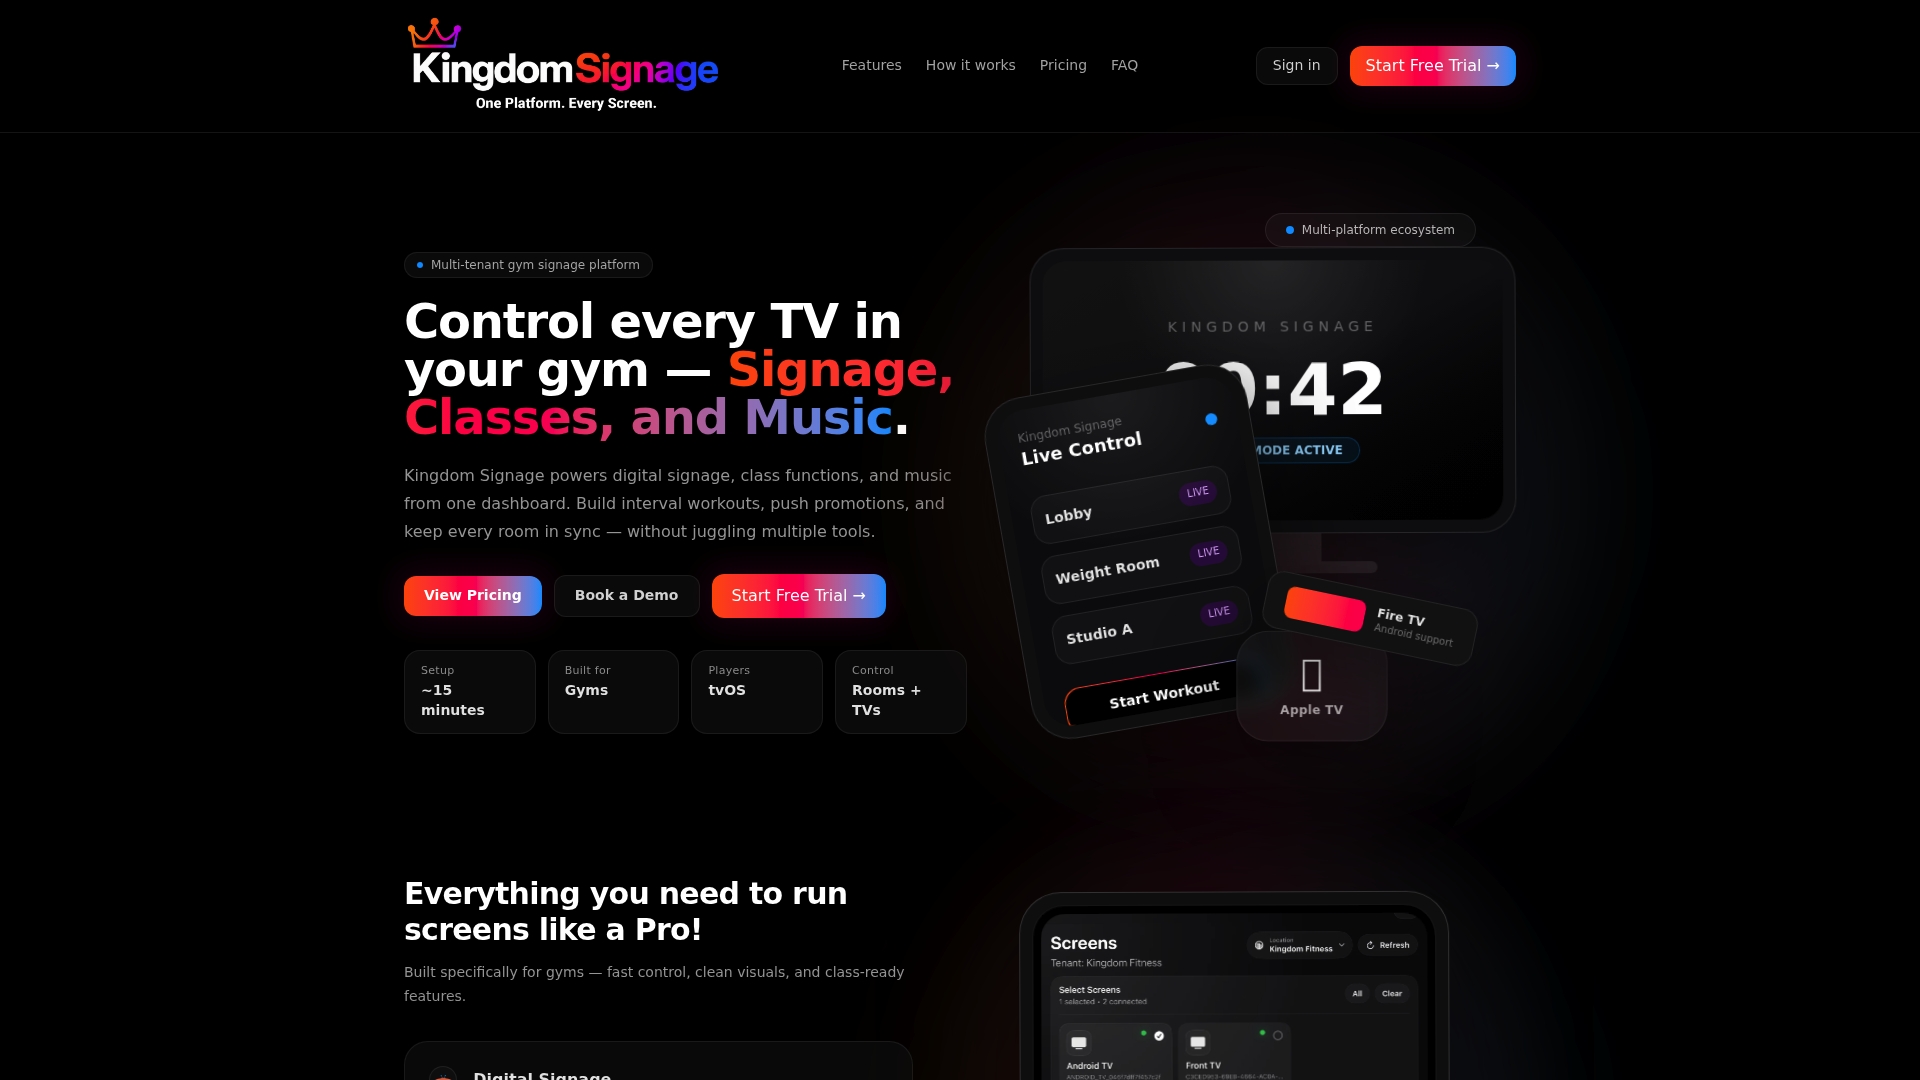
If you're ready to test the numbers in this article against your own gym, start a demo with Kingdom Signage and see how quickly a pilot comes together.
FAQ
What is a realistic payback period for gym digital signage?
Most gyms running a focused pilot see payback within one to four months when screens sit near the point of sale or class schedule. A payback period stretching past six months usually points to weak placement or content rather than the technology itself.
How many screens does a gym need to see measurable ROI?
There's no fixed minimum, but two to four screens in high-traffic zones like the front desk or studio entrance are enough to run a meaningful pilot. Scaling up after a successful pilot, as covered in our multi-location playbook, works better than installing everywhere at once.
Does digital signage really increase retail sales in gyms?
A large field experiment found an 8.1% average purchase-lift from in-store digital signage, with stronger effects when signage sits close to the promoted product. Gym retail counters near a screen displaying supplement or apparel promotions tend to see a similar effect, though results vary by product and placement.
What's the difference between CAPEX and OPEX for gym signage?
CAPEX covers one-time purchases like screens, mounts, and media players, while OPEX covers recurring costs like software subscriptions, content creation, and music licensing. Annualizing CAPEX over the hardware's useful life lets you compare it directly against monthly revenue gains in your ROI model.
How does Kingdom Signage support a signage ROI pilot?
Our platform unifies screen content, class schedules, and room-by-room audio in one dashboard, which cuts the setup time needed to launch and monitor a pilot across multiple rooms. That consolidation makes it easier to push a consistent promotion everywhere at once and pull clean measurement data back without juggling separate tools.
Sources
- In-store advertising with digital signage (field experiment, University of Bath)
- Digital Signage: A Complete Guide - Commercial Integrator
- Fitness Studio Benchmark Reports: How Your KPIs Compare to Studios Your Size — Zatrovo Blog