
The eight member engagement statistics that predict churn before it happens are: visit frequency, visits per member per month, active-use rate, class attendance rate, monthly and annual retention/churn, length of engagement (LEG), NPS/CSAT score, offer-redemption rate, dwell time, failed-payment recovery rate, and at-risk-member count. According to the HFA 2026 report, 81 million Americans held a fitness facility membership in 2025, generating nearly 7 billion visits, with the share of inactive members falling to 4.6%. The industry anchor for annual retention sits at 66.4% as of the HFA 2025 benchmark; boutique studios should target 75–80%.
Quick reference targets to carry into every section below:
- Visit frequency: 2+ visits per week per active member
- Monthly churn: under 5%
- Annual retention: 66.4% industry average; 75–80% for boutiques
- Failed-payment recovery: 70%+ of retried payments collected
- At-risk flag: any member below 1 visit/week for three consecutive weeks
These six dimensions structure the rest of this article: metric definition, why it matters, benchmark/target, how to measure it, tracking cadence, and expected business impact.
Key Takeaways
Member engagement in U.S. gyms is measurable, benchmarkable, and directly improvable through a combination of consistent data tracking, targeted at-risk outreach, and synced in-club messaging.
| Point | Details |
|---|---|
| Track visit frequency first | Members below 1 visit/week for three weeks are your highest-churn risk; flag and contact them immediately. |
| Use 66.4% as your retention baseline | The HFA 2025 benchmark of 66.4% annual retention is the current industry anchor; boutiques should target 75–80%. |
| Fix failed payments before marketing | Involuntary churn can be 10–40% of cancellations; a 70%+ recovery rate is achievable with a basic retry sequence. |
| Tie signage to booking events | Real-time class-fill alerts on lobby screens can lift off-peak attendance; measure by tagging bookings made within 90 minutes of a screen impression. |
| Kingdomsignage unifies the data layer | Kingdomsignage's single dashboard syncs screens, class schedules, and offers across rooms, giving operators the impression-to-booking attribution chain the metrics above require. |
Table of Contents
- What are the exact member engagement statistics you should define and track?
- How to measure each metric: formulas, data sources, and cadence
- What to require from engagement-tracking and signage vendors
- A 90-day plan to lift member engagement with measurable experiments
- How to measure and improve gym staff engagement
- Common challenges in gym staff engagement and how to fix them
- How staff engagement and member engagement connect
- Why in-club messaging and staff alignment are the underrated engagement levers
- Kingdomsignage gives you the measurement-to-action loop in one dashboard
- Useful sources and references
What are the exact member engagement statistics you should define and track?
The table below gives each metric a precise, reproducible definition and ties it directly to retention or revenue.
| Metric | Definition | Why it matters |
|---|---|---|
| Visit frequency | Avg. visits per member per week | Members visiting 2+/week churn at roughly half the rate of once-a-week members |
| Visits per member/month | Total check-ins ÷ active members | Tracks engagement depth across the whole base |
| Active-use rate | Members with 1+ visit in 30 days ÷ total members | Flags passive members before they cancel |
| Class attendance rate | Class bookings attended ÷ bookings made | Low show-up rate signals scheduling or motivation problems |
| Monthly churn | Cancellations in month ÷ members at month start | Direct revenue signal; under 5% is the healthy benchmark |
| Annual retention | Members retained over 12 months ÷ starting members | Matches HFA methodology for apples-to-apples benchmarking |
| LEG (length of engagement) | Avg. months a member stays active | Longer LEG = higher LTV; tracks cohort health over time |
| NPS/CSAT | Net Promoter Score or satisfaction survey score | Predicts word-of-mouth growth and early dissatisfaction signals |
| Offer-redemption rate | Offers redeemed ÷ offers displayed or sent | Measures whether promotions actually change behavior |
| Dwell time | Avg. time a member spends in-facility per visit | Longer dwell correlates with higher class participation and spend |
| Failed-payment recovery | Payments retried and collected ÷ total failed payments | Involuntary churn is often 10–40% of total cancellations |
| At-risk-member count | Members flagged below engagement threshold | Leading indicator; act before they cancel |
Start here if you have limited bandwidth. Three metrics reveal danger fastest: monthly churn rate, visit frequency per member, and at-risk-member count. If monthly churn climbs above 5%, visit frequency drops below 1.5/week for a cohort, or your at-risk count grows week over week, those three signals together almost always precede a larger cancellation wave.
According to PushPress's retention guide, a gym running 2% monthly churn generates roughly three times the lifetime value of one running 6% monthly churn. The math is straightforward: LTV = average monthly revenue per member ÷ monthly churn rate. Cutting churn from 6% to 4% on a 500-member base at $60/month adds approximately $25,000 in annual retained revenue without a single new acquisition.
How to measure each metric: formulas, data sources, and cadence
Primary data sources for a typical gym: access-control/check-in logs, class-booking system, POS system, CRM, digital-signage analytics, payment gateway reports, and short member pulse surveys. Secondary signals include app opens and wearable integrations where available.
Sample calculations:
- 81 million Americans were members of a fitness facility in 2025, new HFA report finds
- Gym Retention Rate Benchmarks 2026: The Number, Methodology — Nutripy
- Gym Member Retention: The Complete Guide (2026) | PushPress
- Gym Churn Reduction Framework: Identify, Intervene & Save Members
- Retention Metrics Dashboard Gym Owners
- Real-Time Offer Display Benefits for Gyms: Owner's Guide
- Why Gym Screen Dwell Time Matters for Retention
- How Gym Screen Uptime Affects Members and Retention
Tracking cadence:
| Metric | Cadence | Why |
|---|---|---|
| Visit frequency | Daily/Weekly | Early warning; act before 6-week decline solidifies |
| Monthly churn | Monthly | Revenue planning and cohort comparison |
| At-risk-member count | Weekly | Intervention window is short |
| Failed-payment recovery | Weekly | High-leverage, fast-fix revenue lever |
| Annual retention | Quarterly | Benchmarking against HFA figures |
| NPS/CSAT | Quarterly | Trend tracking; not a daily signal |
| Offer-redemption rate | Per campaign | Ties signage spend to behavior change |
Two data-hygiene rules that matter: exclude members who joined in the current month from your retention denominator (they haven't had a full period to churn), and split involuntary churn (failed payments) from voluntary cancellations. Mixing them hides the payment-recovery opportunity, which research shows can account for 10–40% of total cancellations.
What to require from engagement-tracking and signage vendors
Not every platform gives you the raw data you need to run the formulas above. Before signing a contract, verify these capabilities:
- Real-time check-in feed with exportable timestamps
- Class-booking API or webhook for booking and attendance events
- Aggregated visits reporting with cohort filtering (new vs. tenured members)
- Payment-retry telemetry with success/fail outcomes
- Signage analytics: impressions, dwell time per screen, offer-redemption linking
- Segmentation and cohort queries (at-risk filter, frequency bands)
- Exportable raw data (CSV or API) so you own your numbers
Vendor red flags: no raw data export, closed analytics dashboards you can't query, no multi-location control, and signage systems that can't tie screen impressions to booking or purchase events.
Kingdomsignage addresses several of these requirements directly. Its single dashboard controls TV screens, class scheduling displays, workout timers, and room-by-room music from one interface, which means check-in moments, class transitions, and promotional offers all run through one system. Screen uptime and reliable content delivery reduce friction at high-traffic moments, and dwell-time-aware content scheduling lets operators time offers to the moments members are most likely to act.
Pro Tip: Ask any signage vendor to show you a live export of impression data linked to a booking event. If they can't demo it in 10 minutes, assume it doesn't exist.
A 90-day plan to lift member engagement with measurable experiments
Days 1–30: data cleanup and at-risk segmentation
- Audit your check-in data for duplicates and missing entries; establish a clean baseline for visit frequency and active-use rate.
- Build your at-risk cohort (members below 1 visit/week for 3 weeks) and export a contact list.
- Run a failed-payment audit; identify how many cancellations in the last 90 days were involuntary.
Days 31–60: targeted interventions and signage offers
- Launch a re-engagement campaign for the at-risk cohort: a personal outreach message plus a time-limited class-pass offer displayed on in-club screens.
- Set up real-time class-fill alerts on lobby screens to nudge walk-ins into underbooked classes.
- Implement or tighten your payment-retry sequence (3 attempts over 7 days is a common starting point).
Days 61–90: A/B test offer formats and automate recovery
- Test two offer formats on signage (discount vs. free add-on) and measure redemption rate and downstream visit frequency for each cohort.
- Automate payment-recovery follow-up with a text/email sequence triggered by gateway failure events.
- Review at-risk cohort size week over week; stop/go criterion is a 10% reduction in at-risk count by day 90.
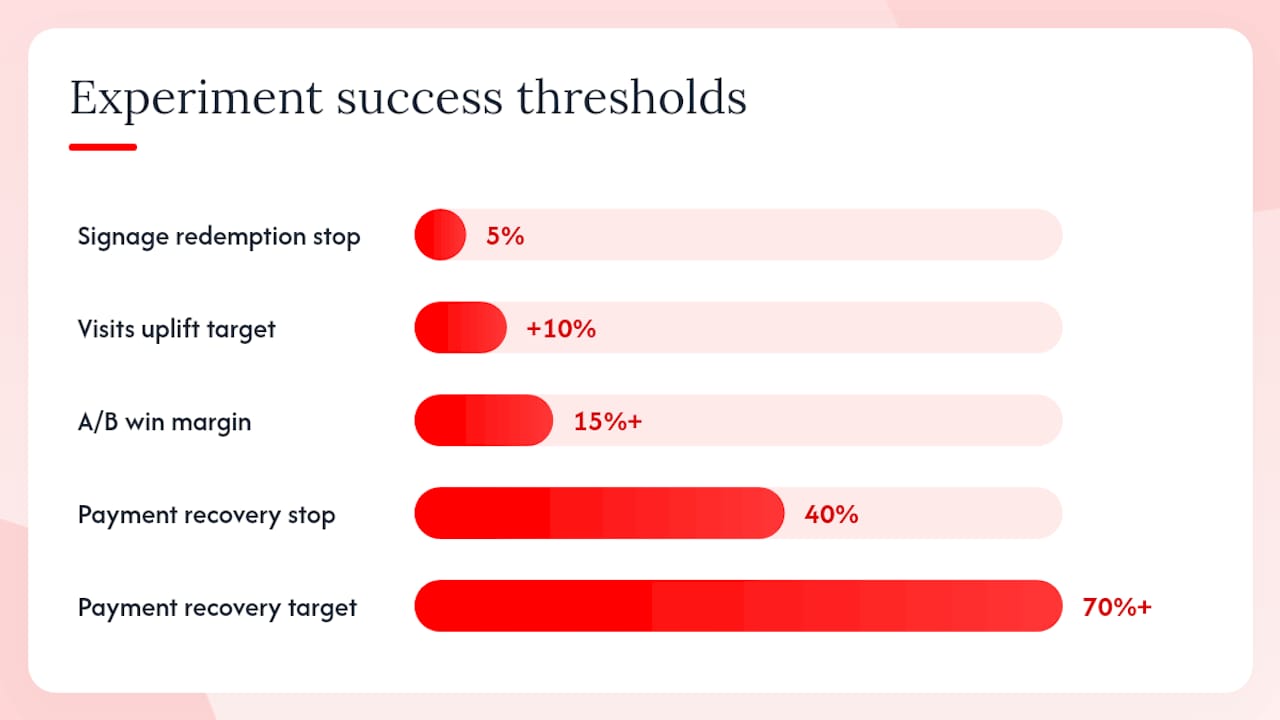
| Experiment | Estimated cost | Success metric | Stop/go |
|---|---|---|---|
| Data cleanup + segmentation | Staff time (~4 hrs) | Clean baseline established | Go if at-risk list is buildable |
| At-risk outreach + signage offer | — | +10% visits/week in cohort | Stop if redemption under 5% |
| Payment-retry automation | — | Recovery rate 70%+ | Stop if recovery under 40% after 30 days |
| Offer A/B test on signage | Staff time + creative | Higher-converting format identified | Go if one format beats other by 15%+ |
How to measure and improve gym staff engagement
Staff engagement in a gym context means how connected, motivated, and aligned your instructors and front-desk team are with the member experience they're delivering. It's worth measuring because disengaged staff create friction at exactly the moments that matter most: the first check-in, the class intro, the post-workout conversation.

Three practical measurement approaches work well for small gym teams:
Short pulse surveys. A three-question weekly survey (confidence in today's schedule, one thing that would make the shift easier, overall energy level) takes under two minutes and surfaces operational problems before they reach members. Tools like Google Forms or Typeform handle this at no cost.
Shift-level attendance and class-fill tracking. When a specific instructor's classes consistently underperform on attendance or show higher no-show rates, that's a signal worth a conversation, not a performance review. Pair the data with a brief check-in before the next shift.
Front-desk response time and offer-delivery consistency. If your signage system is pushing a promotional offer, track whether front-desk staff are reinforcing it verbally. A simple tally sheet or a CRM note field works. Consistency between what screens say and what staff say is where the member experience either holds together or falls apart.
Common challenges in gym staff engagement and how to fix them
Inconsistent scheduling is the most common complaint in fitness operations. Instructors who don't know their schedule two weeks out can't plan, which raises stress and accelerates turnover. Fix: publish schedules three weeks ahead and use your signage system to display the week's class lineup in the staff area, not just the member-facing lobby.
No feedback loop between staff and management. Front-desk staff see member complaints and cancellation signals before any dashboard does. If there's no structured way to surface that information, it disappears. Fix: a five-minute end-of-shift note in your CRM or a shared Slack channel for member flags.
Misaligned incentives. Staff are often rewarded for shift coverage, not member outcomes. Tying a small bonus or recognition to the at-risk cohort conversion rate (how many flagged members came back after outreach) aligns staff behavior with the metrics that actually matter.
How staff engagement and member engagement connect
These two sets of metrics are not parallel tracks. They feed each other directly.
| Staff metric | Member metric it drives | Mechanism |
|---|---|---|
| Instructor retention rate | Class attendance rate | Familiar instructors build member habit |
| Shift fill rate | Visit frequency | Cancelled classes reduce weekly visits |
| Staff NPS | Member NPS | Mood is contagious; disengaged staff produce disengaged members |
| Offer-delivery consistency | Offer-redemption rate | Staff reinforcement doubles the conversion rate of signage offers |
The practical implication: when your class attendance rate drops, check instructor retention before you redesign the class schedule. When your offer-redemption rate is low, check whether staff are aware of the current promotion before you redesign the creative. The member-facing metric is often a downstream symptom of a staff-side cause.
Why in-club messaging and staff alignment are the underrated engagement levers
Most operators focus on acquisition when retention slips. That's the wrong reflex. The data in this article points consistently in one direction: the members most likely to cancel are already in your building, just visiting less often. The staff most likely to leave are already on your payroll, just getting less feedback.
Consistent in-club messaging reduces the friction that lets disengagement quietly compound. When a member walks in and the screen shows exactly the class they've been meaning to try, with two spots left, that's not marketing. That's a habit nudge at the right moment. When staff know what's on the screens and can reinforce it in a 10-second conversation, the conversion rate on that nudge roughly doubles.
The conventional wisdom says engagement is about programming variety and community events. Those matter. But the operators who move the needle fastest are the ones who close the loop between what the screen says, what the staff says, and what the data shows about who's drifting. That loop is tighter than most studios realize, and it doesn't require a large budget to close.
Pro Tip: Run a brief daily huddle (5 minutes, before the first class) where staff review the day's at-risk member list and the current signage offer. That one habit connects your measurement system to your member-facing team without adding headcount.
Kingdomsignage gives you the measurement-to-action loop in one dashboard
Tracking the metrics in this article requires data from multiple sources: check-ins, class bookings, payment retries, and screen impressions. Most operators manage these in separate tools and never connect them. Kingdomsignage closes that gap.
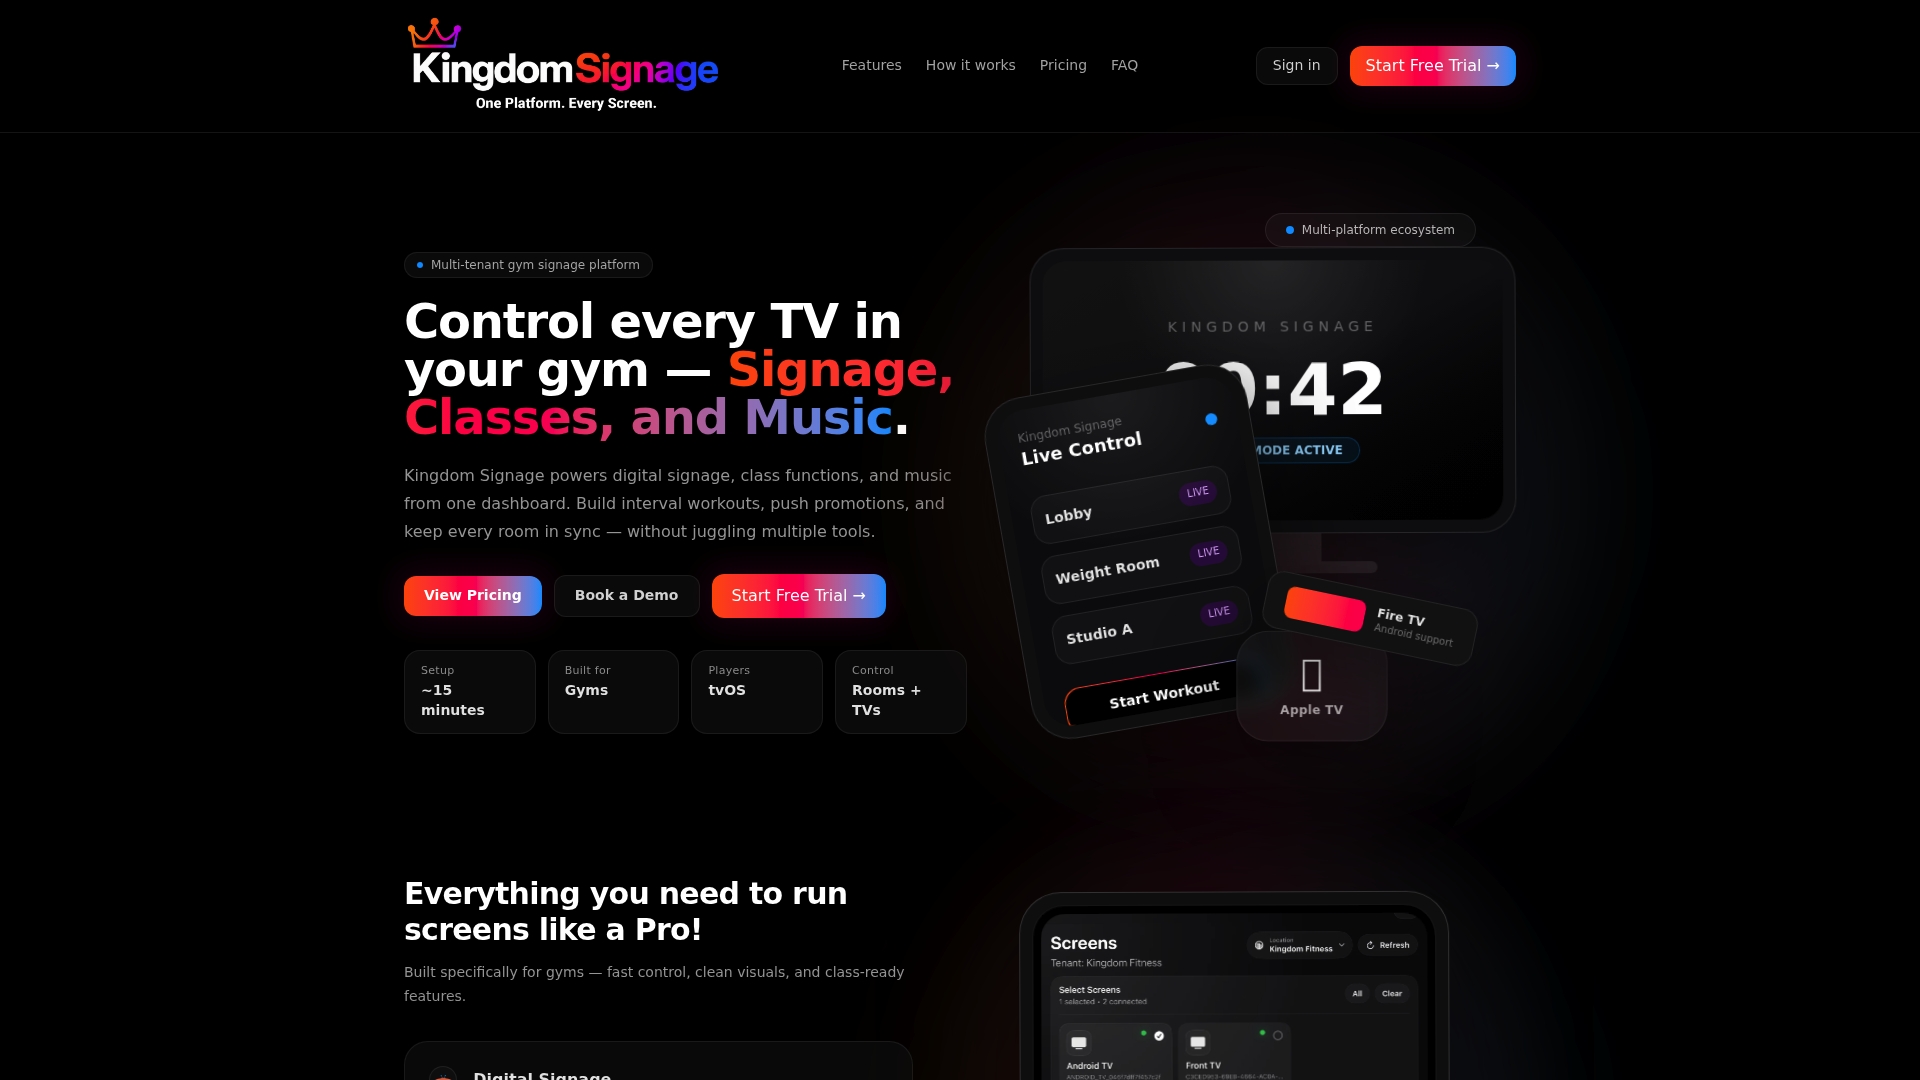
The platform syncs TV screens, class scheduling displays, workout timers, and room-by-room music from a single dashboard, so every screen in your facility can push the same offer at the same moment, or different content by room, without logging into multiple systems. Real-time class-fill alerts, targeted promotional templates, and multi-location control are built in. Screen uptime and content reliability mean your messaging is consistent at the exact moments, like a class transition or a post-workout cool-down, when members are most receptive.
For franchise technology managers running multiple locations, the multi-location control layer means one campaign deploys everywhere simultaneously, and impression data rolls up into a single report you can tie to booking conversions.
Start a demo at Kingdomsignage.com to see how the dashboard maps to the metrics and experiments described in this article.
Useful sources and references
- HFA 2026: 81 Million Americans Were Members of a Fitness Facility in 2025 — source for headline U.S. membership, visit, and inactive-member benchmarks used throughout this article.
- Gym Retention Rate Benchmarks 2026 — Nutripy — explains the 66.4% annual retention anchor and why older figures are outdated; essential for benchmarking methodology.
- Gym Member Retention: The Complete Guide (2026) — PushPress — retention math, LTV calculations, and onboarding rationale.
- Gym Churn Reduction Framework — Rework — at-risk engagement windows, involuntary churn data, and intervention timing.
- Retention Metrics Dashboard for Gym Owners — MakoCRM — seven leading metrics, healthy benchmarks (monthly churn under 5%, 2+ visits/week, 70%+ payment recovery).
- Real-Time Offer Display Benefits for Gyms — Kingdomsignage — operationalizing real-time signage offers and measuring attendance and redemption lifts.
- Why Gym Screen Dwell Time Matters for Retention — Kingdomsignage — content design and timing guidance for maximum member attention.
- How Gym Screen Uptime Affects Members and Retention — Kingdomsignage — uptime effects on member experience and friction reduction at class transitions.