
Gym screen content performance metrics are the analytics layer that tells you whether your digital signage is actually moving members to act or just burning electricity. Most gym owners track impressions and stop there. The real measurement framework separates exposure, attention, and engagement into distinct layers, with tools like Proof of Play, MediaSignage, and Gokorbyt providing the data infrastructure to do it properly. Get this right and your screens become a retention and revenue engine. Get it wrong and you're optimizing for numbers that don't connect to business outcomes.
1. Impressions and foot traffic
Impressions measure how many times a screen is visible to a passing member. Foot traffic counts the number of unique individuals who enter a zone where a screen is placed. Together, these form the exposure layer of gym screen content performance metrics, telling you how much reach your content has before any attention or action is measured. Low impressions almost always point to a placement or scheduling problem, not a creative one. Fix the location or timing before changing the message.

2. Dwell time
Dwell time measures how long a member stays within view of a screen. The average dwell time baseline for passive gym digital screens is approximately 0.7 seconds, which means most content gets a fraction of a second to register. That number sounds discouraging, but it sets a realistic benchmark. Run a pilot phase at your facility to establish your own local baseline, then measure whether content changes move that number. Low dwell time signals a creative or message clarity problem, not necessarily a placement issue.
3. Interaction rate
Interaction rate captures the percentage of viewers who take a physical action after seeing content. In a gym context, this includes QR code scans, touchscreen taps, and app downloads triggered by screen prompts. QR scans estimate engagement and are one of the most trackable signals available without specialized hardware. A low interaction rate on a sales-focused screen means the call to action is unclear or the offer is weak. Test one variable at a time to isolate the cause.
4. Proof of Play
Proof of Play (PoP) is a logged record confirming that specific content played on a specific screen at a specific time. PoP logs confirm what content played, when, and where, making it the floor metric before any audience data is analyzed. Without PoP, you cannot know whether a drop in engagement reflects poor content or a screen that simply did not play the scheduled file. Many gyms over-rely on CMS play counts, which estimate content displayed without real playback verification. Always confirm PoP before drawing conclusions from attention or engagement data.
5. Attention rate
Attention rate is calculated as the percentage of people who dwell long enough to register the content versus total impressions. It sits between exposure and engagement in the measurement hierarchy. A high impression count with a low attention rate tells you the screen is visible but the content is not stopping anyone. This metric is most useful on cardio floors and waiting areas where members have time to look up. Pair it with creative testing to understand which formats hold attention longest.
6. Content creative performance via A/B testing
A/B testing for gym signage means running two versions of content simultaneously across comparable screens or time slots and measuring which performs better against a defined KPI. Effective A/B testing focuses on one variable at a time, whether that is headline copy, image format, or call-to-action placement. For engagement-focused screens, attention rate is the right KPI. For sales-driven content near the front desk, QR scans or class bookings are more appropriate. Aligning the KPI to the screen's role is what makes test results usable.
Pro Tip: Run A/B tests for a minimum of two weeks per variable to account for weekly traffic patterns. Shorter tests in gyms produce misleading results because Monday and Saturday foot traffic profiles are completely different.
7. Conversion metrics
Conversion metrics tie screen content directly to revenue actions: class bookings made after viewing a promotion, personal training consultations scheduled, or membership upgrades completed. The MediaSignage gym case study showed personal training sales rise 38% and member retention climb from 68% to 88% after a structured digital signage deployment. That result came from tracking conversions, not just impressions. Set up UTM parameters on QR codes and cross-reference booking data with screen schedules to build a clean attribution model.
8. Content rotation effectiveness
Content rotation metrics track how often each piece of content plays, whether it completes its full runtime, and how the playlist cycles across a day. Play count shows frequency. Play completion rate shows whether content is being interrupted by system errors or scheduling conflicts. A piece of content with high play count but low completion rate usually points to a technical issue rather than an audience problem. Review rotation logs weekly to catch these errors before they distort your engagement data.
9. Retention and class fill rate
Retention and class fill rate are business outcome KPIs that connect screen content performance to membership health. Track class fill rate 30 days before and after a signage campaign to measure direct impact. Monitor 90-day member retention by cohort to see whether members who engage with screen content stay longer. These metrics require patience because the feedback loop is longer than dwell time or QR scans. They are also the metrics that justify signage investment to ownership and finance teams.
10. Operational metrics
Operational metrics cover scheduling accuracy, system uptime, and content delivery reliability. A screen that is offline 20% of the time cannot deliver consistent impressions regardless of how good the content is. Track uptime as a percentage, log scheduling errors, and monitor whether content updates push correctly across all zones. These metrics rarely appear in marketing discussions about digital signage, but they are the foundation everything else sits on. Without operational reliability, every other metric in this list becomes unreliable.
How to interpret gym content metrics without misreading the data
The most common mistake gym managers make is treating metrics in isolation. Separating exposure, engagement, and action outcomes avoids optimizing misleading metrics and allows proper attribution across the measurement funnel. A screen with high foot traffic but low dwell time has a creative problem. A screen with good dwell time but no QR scans has a call-to-action problem. The diagnosis changes completely depending on which layer you examine first.
Combining footfall, dwell time, and Proof of Play is the standard method for accurately comparing signage performance across gym locations and time periods. PoP correlation is particularly important because without confirming playback, performance drops get misattributed to content quality when the actual cause is a hardware or scheduling failure.
Zone-specific KPIs matter because a cardio floor screen and a front desk screen serve completely different functions. Zone-specific A/B testing requires controlling for footfall differences and using location-appropriate KPIs to produce valid conclusions. Applying the same KPI across every zone produces data that looks clean but leads to wrong decisions.
Pro Tip: Build a simple weekly dashboard with three columns: exposure metrics, attention metrics, and conversion metrics. Reviewing them side by side takes five minutes and immediately shows where the funnel is breaking down.
Choosing the right analytics tools for gym signage
Several platforms offer fitness screen data analysis with different feature sets and price points.
| Platform | Key strength | Best for |
|---|---|---|
| MediaSignage | A/B testing, audience analytics, PoP reporting | Mid-to-large gym chains |
| Gokorbyt | Dwell time tracking, metric framework guidance | Independent gyms starting with analytics |
| Abierto OPEN.CMS | PoP verification, CMS scheduling accuracy | Operators prioritizing playback reliability |
| Navori | AI-powered audience measurement, demographic data | Multi-location operators needing cross-site comparison |
Most platforms integrate with POS systems, which is necessary for tracking conversion metrics like PT bookings and class fill rates. For smaller gyms with limited budgets, starting with PoP reporting and QR scan tracking covers the most critical measurement needs without requiring advanced sensor hardware.
Matching metrics to gym zones and goals
Not every screen needs the same measurement strategy. The right gym content engagement metrics depend on what the screen is supposed to do.
- Front desk screens should prioritize interaction rate and conversion metrics because members are stationary and receptive to offers.
- Cardio floor screens should track dwell time and attention rate because members are present for extended periods but not in a buying mindset.
- Class studio entrance screens should measure class fill rate and booking conversions directly tied to the content displayed.
- Locker room or recovery area screens are best measured by retention impact over time rather than immediate interaction.
Budget-conscious operators can start with QR code tracking and PoP verification across all zones before investing in sensor-based audience measurement. These two metrics alone provide enough data to make meaningful content decisions and justify further investment.
Key takeaways
Gym screen content performance metrics work only when exposure, attention, and conversion data are measured together and interpreted in context of each screen's role.
| Point | Details |
|---|---|
| Layer your metrics | Measure exposure, attention, and conversion separately to diagnose problems accurately. |
| Always verify Proof of Play | Confirm content actually played before analyzing audience or engagement data. |
| Align KPIs to screen function | Front desk screens need conversion KPIs; cardio screens need attention metrics. |
| A/B test one variable at a time | Isolating variables produces findings you can act on without guessing. |
| Connect metrics to business outcomes | Retention rate and class fill rate are the metrics that justify signage investment. |
What most gym operators miss about screen metrics
From our experience working with gym operators across different facility sizes, the single most overlooked metric is Proof of Play. Operators spend hours analyzing dwell time trends and QR scan rates without first confirming that the content actually played as scheduled. That is like analyzing a marketing campaign's click-through rate before checking whether the ads were served. PoP is not glamorous, but it is the foundation.
The second pattern we see consistently is over-investment in impression counts. High foot traffic past a screen feels like success, but a 20-point retention increase like the one documented in the MediaSignage case study came from conversion-focused content tied to measurable booking outcomes, not from maximizing impressions. Impressions tell you about reach. They say nothing about whether a member renewed their membership or signed up for a class.
The gyms that get the most from their signage treat content measurement as an ongoing practice, not a post-campaign review. They run A/B tests continuously, review PoP logs weekly, and adjust zone-specific KPIs as their programming changes. That discipline is what separates operators who see measurable retention gains from those who have expensive screens showing content nobody tracks.
— Kingdom
See how Kingdomsignage tracks what your screens actually do
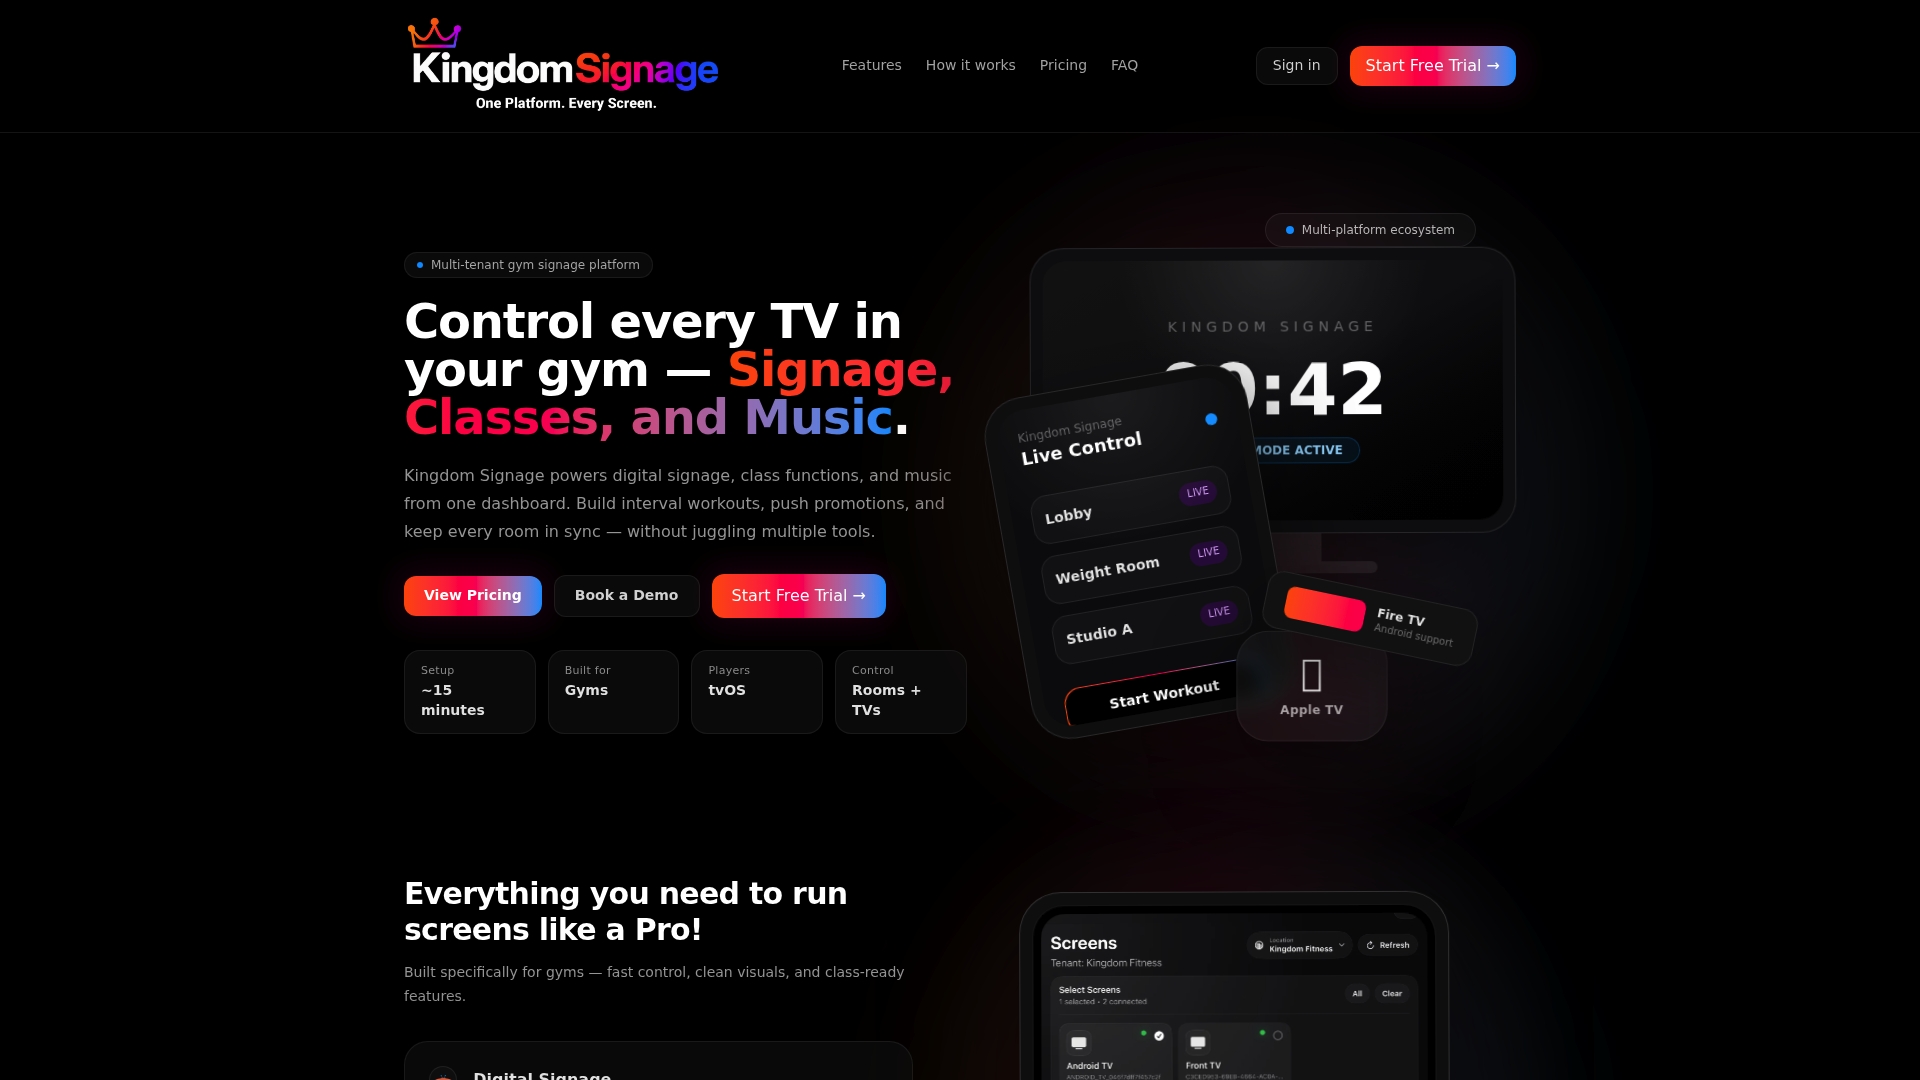
Kingdomsignage gives gym operators a single dashboard to manage digital signage, audio, and class content across every zone in the facility. The platform supports Proof of Play verification, content scheduling accuracy, and real-time updates without requiring separate tools for each function. If you want to move from guessing about screen performance to measuring it with the metrics covered in this article, explore Kingdomsignage and see how gym-specific content management changes what your data can tell you.
FAQ
What are gym screen content performance metrics?
Gym screen content performance metrics are analytics that measure how digital signage performs across exposure, attention, and engagement layers. They include impressions, dwell time, interaction rate, Proof of Play, and conversion metrics like class bookings.
What is a good dwell time for gym digital signage?
The industry baseline for passive gym screens is approximately 0.7 seconds. Gyms should establish their own local baseline during a pilot phase and measure content changes against that benchmark rather than an industry average.
Why is Proof of Play the most important metric?
Proof of Play confirms that content actually played on the correct screen at the scheduled time. Without it, performance drops cannot be accurately attributed to content quality versus hardware or scheduling failures.
How do I measure whether signage improves member retention?
Track class fill rate and 90-day member retention by cohort before and after a signage campaign. A 30-day pre-and-post comparison of class fill rate provides a clear signal of whether content is driving attendance behavior.
Should every gym zone use the same KPIs?
No. Front desk screens should prioritize conversion metrics like bookings and QR scans. Cardio floor screens are better measured by attention rate and dwell time. Matching the KPI to the screen's function produces data you can act on.